
Why we use Blackfire to speed up TYPO3 websites
At b13, we treat slow websites like a bug. If your TYPO3 website takes too long to load, there’s usually something worth fixing. Blackfire is a tool that helps you catch those issues and improve your site’s performance.

People often approach us with the same pressing issue: can you make our website faster? To answer them, we usually need to ask another question first: what’s slowing the website down? We treat slow websites like a bug because they represent a larger performance issue. Luckily, we have a toolbox for figuring out the problem, and one of our go-to tools is Blackfire. Blackfire is great for monitoring your website’s performance and catching those slow performance “bugs.”
It’s worked so well for us that we’ve developed workshops teaching others how to use Blackfire on their websites. Read on for an overview of how Blackfire works, why we use it for TYPO3 websites, and the types of issues it can help solve.
This post is part of our Blackfire Series
- Part 1: Why we use Blackfire to speed up TYPO3 websites
- Part 2: Set (and Surpass) Your Website’s Performance Baselines
- Part 3: Check up on your Front-End Cache in TYPO3
What is Blackfire?
Blackfire is a dynamic code profiler that monitors your website’s performance. This means that if you run a PHP application (like TYPO3), and it’s running slowly, Blackfire can tell you which part of your application is taking the longest to load.
People usually start using Blackfire when they have an unknown performance issue in their website project, or when they notice that a page is taking longer to load than usual. It originated as a PHP-specific code profiler, so it works really well with TYPO3 and analyzes your code along the following dimensions:
- Memory: How many megabytes of memory get used up as your website is served?
- Time: How long does your page take to load?
- I/O: How many files are read from, or written to, your hard drive?
- Number of calls: How many functions or methods were called during the page load?
Static vs. dynamic profilers
Static code profilers go through the code without actually calling any of it, and try to find errors with the way the code is written. They’re great for catching some bugs, but they won’t tell you how long a website takes to load. Two popular examples are PHPStan and Psalm.
Dynamic profilers, on the other hand, analyze code while it’s being executed—in other words, while the website is being served. Blackfire is a dynamic code profiler, which means it helps improve performance.
Time is relative
Google ranks page speed in their search algorithm because users abandon pages when they take too long to load. But if your website is slow, the overall time it takes to load matters less than which parts of your web app are taking the most time. When it comes to diagnosing your website, you can’t always tell if the issue is you (i.e. your internet connection) or the website itself. That’s why measuring relative time is important—you want to see what’s making it slow.
When you try to load a website in your browser, there’s a three-step process (a bit simplified, below):
- Your browser sends a request to the web server.
- The server processes the request and sends a response.
- Your browser loads and renders the website.
Blackfire calculates step #2: how long a server takes to process your request and send a response, once it receives that request.
Where Blackfire’s performance monitoring fits into your workflow
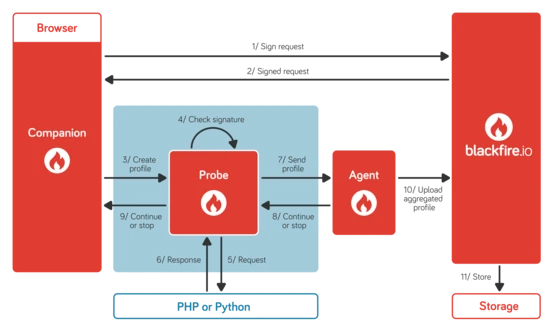
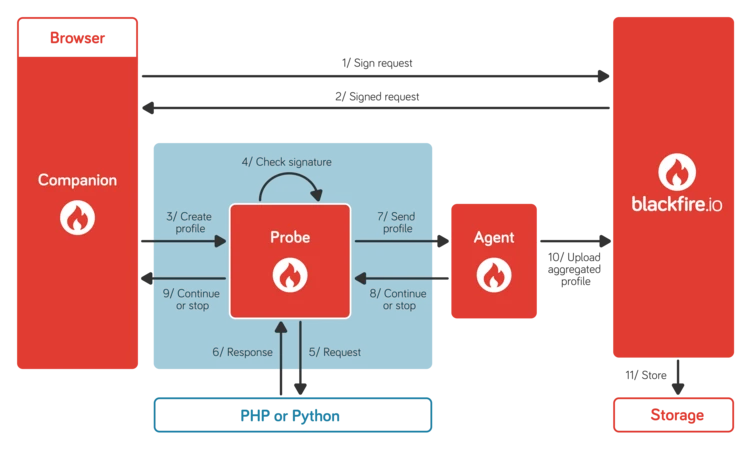
Blackfire needs to be installed in two places to monitor your application: first as a PHP probe on your server, and second as either a browser extension (right now they’re enabled for Chrome and Firefox) or as a CLI tool.
Once you’ve installed Blackfire on your server, you activate it through your web browser. Then what happens?
- First, the browser extension validates whether you’re logged in with your web app’s account details.
- Blackfire gathers information from your server: it runs a profile of everything you want to be checked, authenticates with your server, and gathers the data.
- The Blackfire Probe on your server sends data (no user data, credentials, or code) to Blackfire’s servers at https://blackfire.io/.
- Blackfire.io uploads the performance stats to their website, which you can check when you’re logged into your account.
- If you want to, you can store the results on Blackfire.
Where to run Blackfire
What’s great about this setup is that Blackfire doesn’t run on every request, which would use up resources every time someone visits your website. To run Blackfire, you have to explicitly activate it through your web browser’s extension. This also means you don’t have to worry about writing explicit calls to start and stop Blackfire at different points in your source code (though you can—more to come on that in a later article).
The cool thing is that you can run it on a local machine, staging environment, or production server—it can run anywhere so long as it’s set up. And if you have server access, setting up Blackfire only takes a couple of minutes and a few lines of configuration code.
How to monitor your website with Blackfire (the basics)
The primary reason we use Blackfire is that it saves us a lot of time. On our own, it would take a while to figure out whether a slow website is the result of a database issue, a problem with extensions, or a bottleneck in TYPO3 Core. With Blackfire, what might take me between one and eight hours takes about five minutes: identifying the root cause of the performance bottleneck.
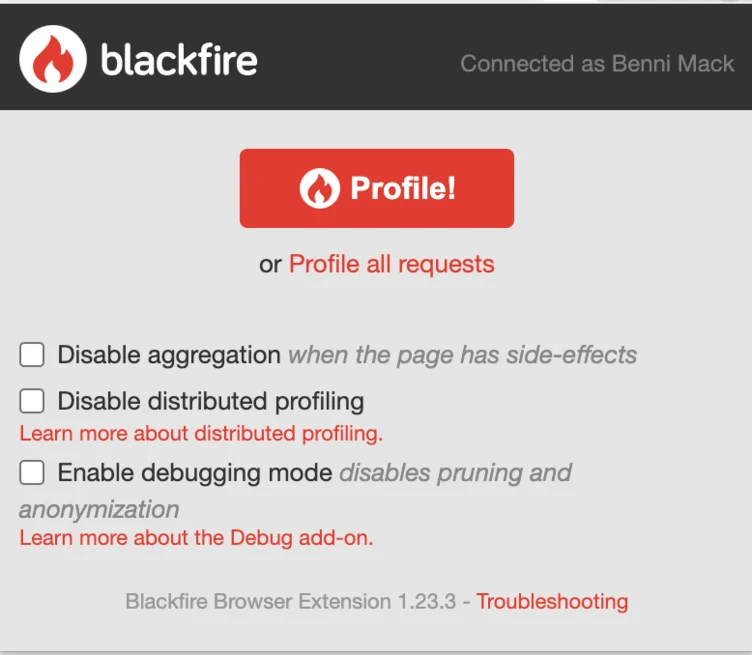
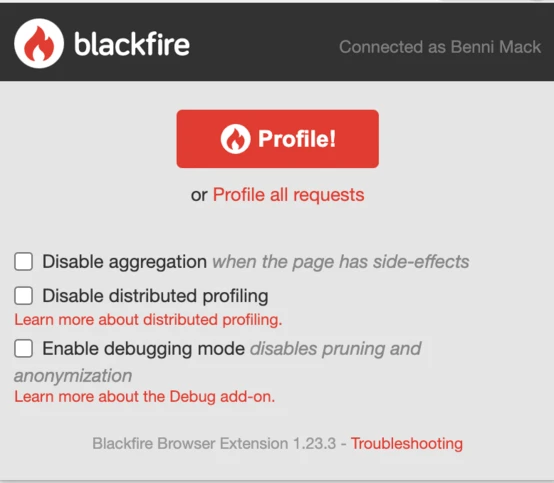
Check your first request separately
When you click the orange “Profile” button without ticking other boxes, Blackfire calls the website 10 times to get the median response times. With TYPO3, you probably don’t want to click “Profile” right away if you’re measuring how long the first page request takes. That’s because of the way TYPO3 caching works: we know the website will take a lot longer to load on the first request than the subsequent ones—a first request might take 10 times longer than the second, third, or fourth request.
But it’s still useful to know how long the first request takes! To measure how long the first-page request takes, check the “Disable aggregation” box. This makes Blackfire call the website only once.
Measure the cached requests
As I mentioned, relative time is the most useful measure when using Blackfire for the first time. So if the first request takes eight seconds, and on the second request it goes down to two seconds, we know that TYPO3’s caching has made the website 400% faster.
Checking “Profile all requests” allows Blackfire to monitor AJAX requests so that it can profile all the requests fired off while a user is browsing and interacting with different parts of the website.
Pro Tip: Ideally you don’t have a running TYPO3 Backend in the same browser session, because Frontend requests might become a tiny bit slower.
Analyze the results
Once the profiler has run, you can view some topline stats (shown below) by clicking on the icons on the browser bar. These stats include how much time the website took to load, CPU, RAM, the number of outside URL requests (and how long they took), and the number of database requests (and how long they took).

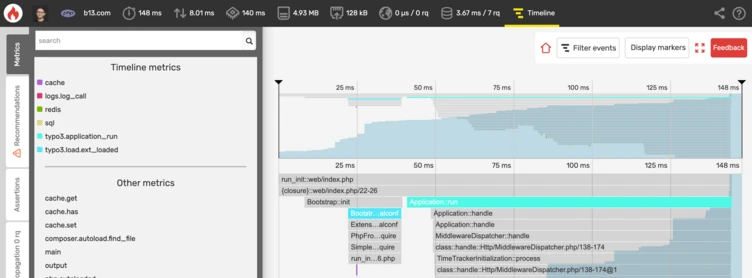
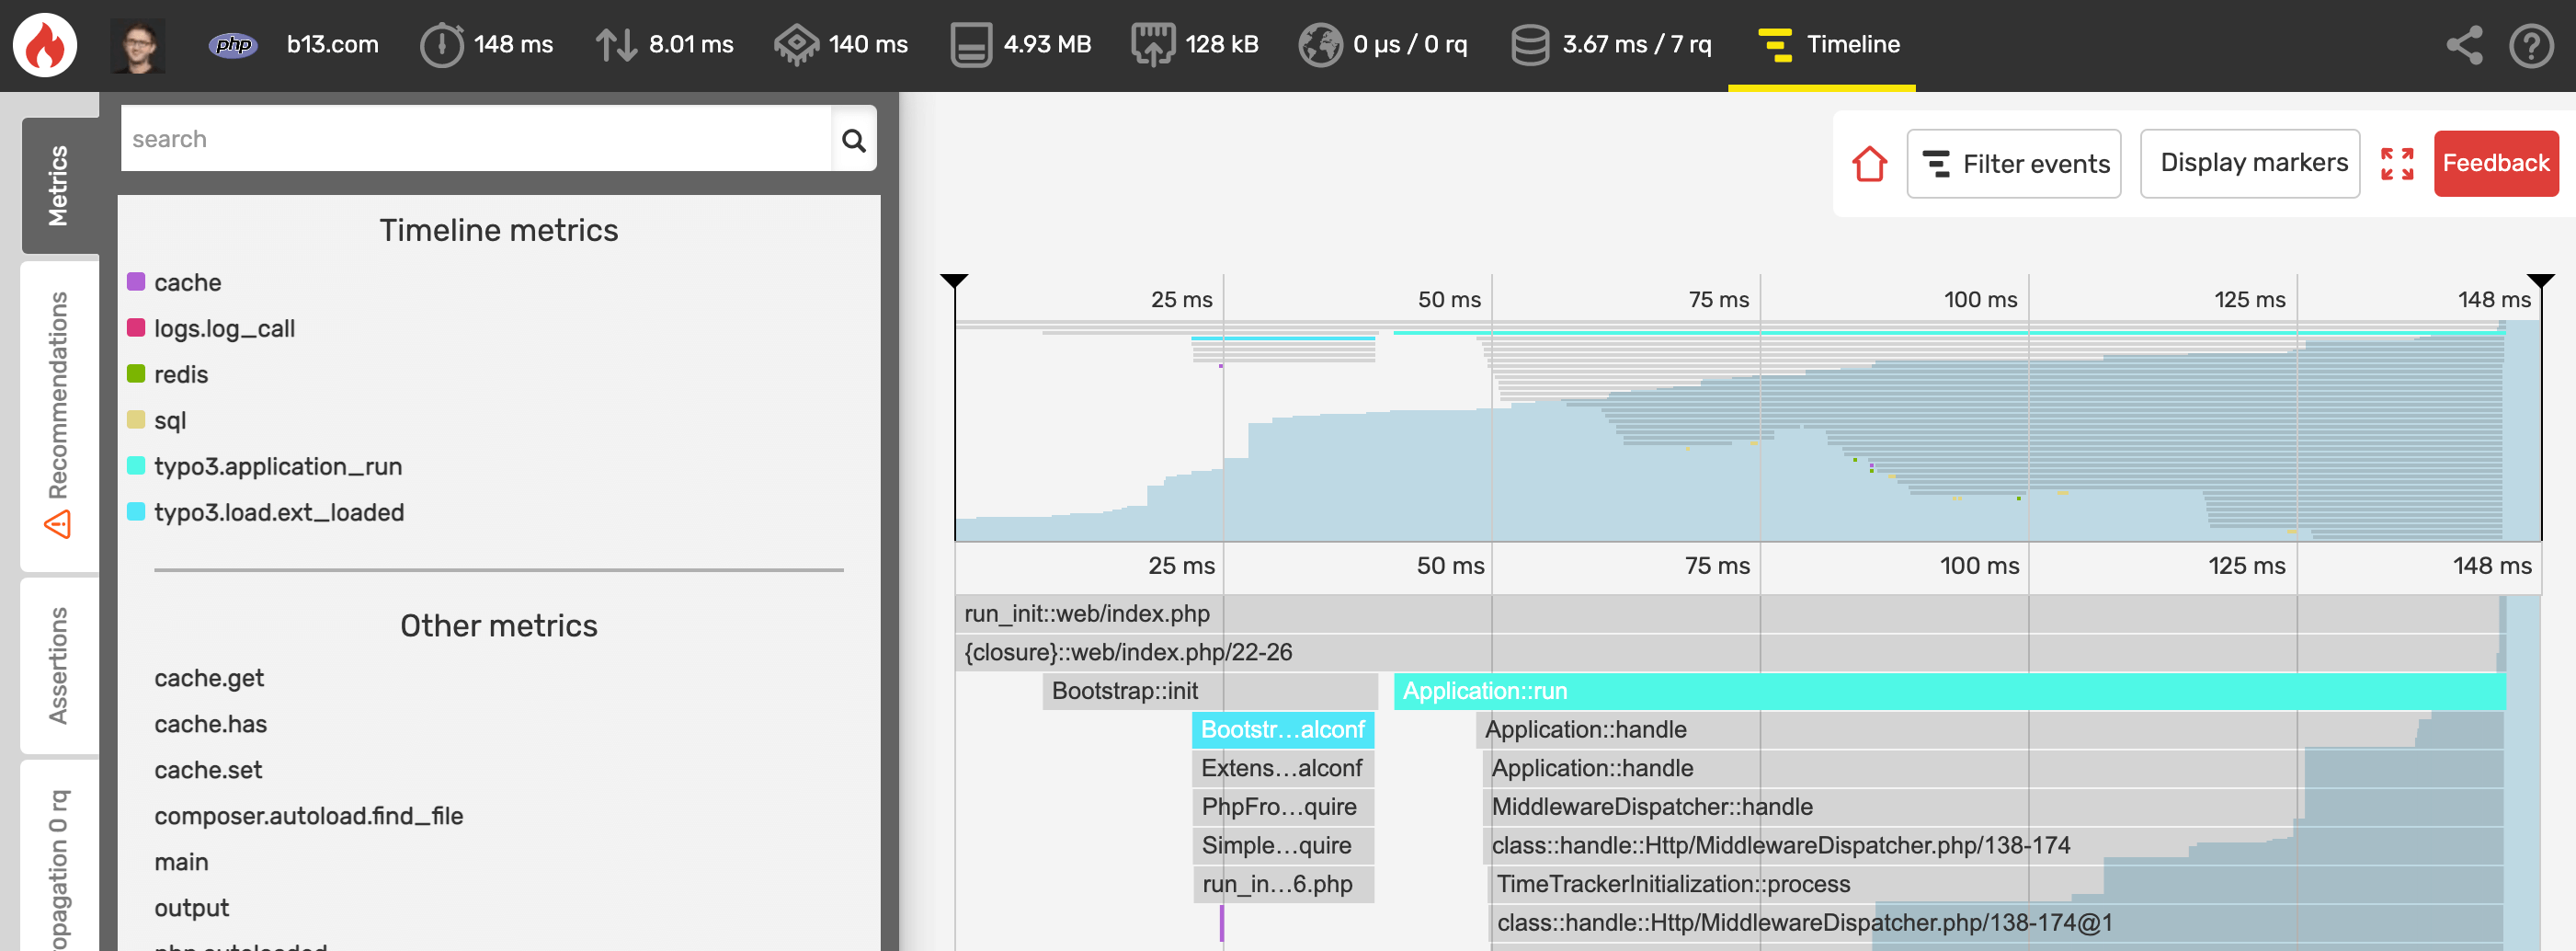
For a more detailed view of your performance, you can click on “View Timeline.” This will give you a linear breakdown of the points in time at which RAM was used or database requests were made.
You can also switch to a time-oriented visualization, which will show you which resources took the largest proportion of time. And once you know which resource is taking the most time, you can inspect it individually.
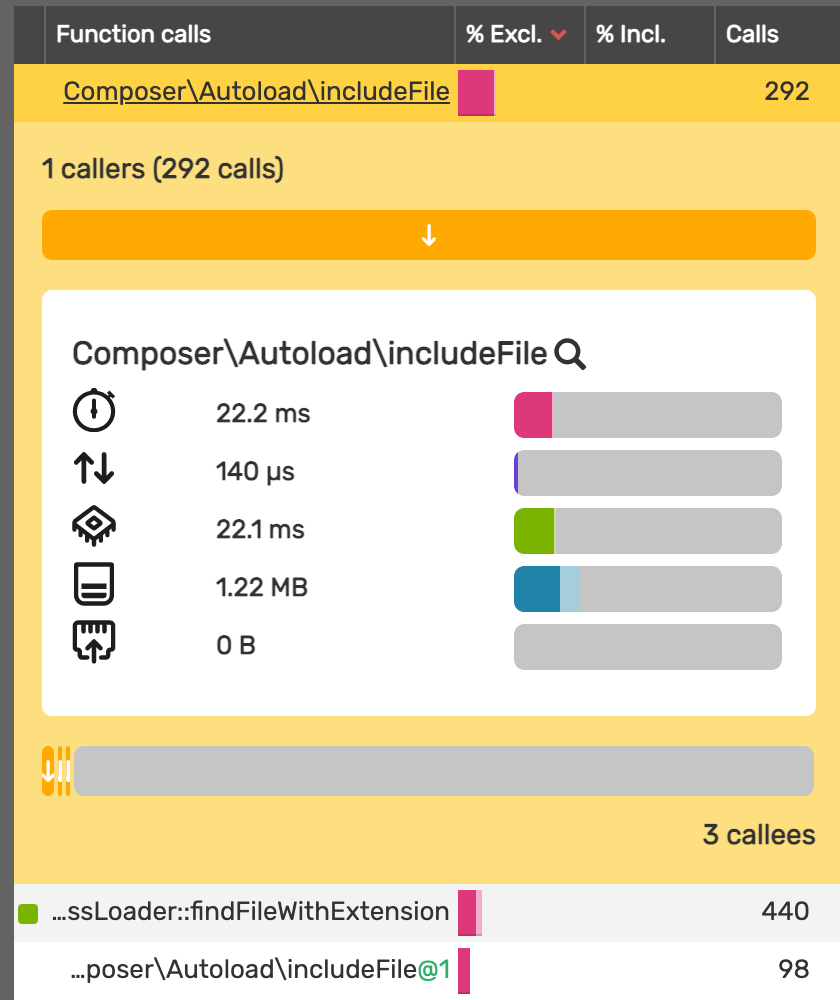
In the screenshot above, I’m looking at Composer—which autoloads source files during a PHP request. By looking at the visualization above, I can see it was called 292 times, to load 292 PHP files, and it took 22.2 milliseconds. Think of it like this: Just to load all PHP files for this request, this should be a fraction of the total time. If I’m looking at cached results, this is suboptimal—while it’s okay for the first request of a website to take around a second, I usually aim for a cached hit to take 100–150 milliseconds. But just this one function has already used up a fifth of that time.
Act on the data
In the case above, I might see if I can reduce the number of PHP files my website is using, or use a PHP optimization tool to reduce the time those files take to load. Actually, I had already optimized the PHP file loading via Composer’s Authoritive Autoloader (this was more than 100ms before my optimization). But this is just one example: you might reduce the number of queries if it’s your database that’s slowing you down, or remove any faulty extensions. The important thing is knowing what the “bug” that’s slowing your website down is. Blackfire gives you insight into what’s happening, so you can figure out what the best fix is, or decide that a tradeoff on performance is worth it.
How Blackfire saved our client from a ghastly “loading” spinner
All of these diagrams and screenshots are nice, but I like to share real stories about how Blackfire has helped some of our customers. So here’s one about a loading spinner: A while back, we added some personalization features to one of our client’s websites. This gave it a more customized feel, but before we launched the feature we noticed the page was loading slower than before—it took about a second in total to create the page on the server.
Our client suggested we add a loading spinner on the homepage, which not only creates an unpleasant user experience but takes some time to build and test. Unacceptable!
Instead, I took an hour to update their PHP version from 5.5 to the latest version. This resulted in a 30% performance increase. After that, I ran Blackfire. Their performance stats showed me that there were elements on the website that could have been cached but weren’t (a TYPO3-specific caching issue). After I defined those elements as cacheable, loading time had decreased from the initial one second to 150 milliseconds.
So, in less time than it would have taken to build an annoying loading spinner, we used Blackfire and sped up the website by almost a factor of seven!
Start using Blackfire for your TYPO3 website
We think Blackfire is a great addition to TYPO3’s workflow, which is why we use it to test TYPO3 Core. It helps you figure out why your website is running slowly, and what you can do about it.
Also, keep an eye out for future blog posts on Blackfire—we’ll be delving into the technical details and discussing what sorts of benefits you can get from it once it’s installed! For in-depth training on how to set up and begin using Blackfire, we offer workshops, too.