
Mastering Website Flowcharts
A Comprehensive Guide to Designing, Developing, and Utilizing Interactive Web Flow Diagrams

“Flowcharts? What are they good for? Our website has a logical, systematic page hierarchy. It contains a multi-level menu to reach about every page directly. And the links between pages grow naturally based on the context.”
Once your website is built, don’t be tempted to “set and forget.” In reality, websites grow and change, pages become stale, duplicate content may appear, and a particular navigation path may not always be the best path for a user to achieve their goal. Let’s face it: A website can grow from simple to complex in no time. The more complex a website becomes, the less obvious the user navigation steps are.
Is your page hierarchy logical from the user’s perspective? (They don’t know what you know about your content.) Is your menu really helpful, or just overwhelming? Do links between pages lead the user to the information they seek in the least amount of time? Looking at the live website does not deliver the answers to questions like these. It is too easy to focus on the paths a user should take and miss the paths a user might take instead.
Creating a representation of a website’s structure in the form of a flowchart diagram helps remove any blind spots by visualizing the navigation paths users take on a website. Flowcharts help designers and developers communicate about effective website design to anticipate the users‘ needs and meet expectations. Consider flowcharts as a compass that helps set the direction of your website structure and navigation flow to achieve an intuitive and satisfying user experience.
This comprehensive guide explains the essence of flowcharts and their usefulness in collaborative design. It walks you through the steps of creating effective flowcharts, including some advanced techniques and a glimpse into the future.
The Purpose and Significance of Website Flowcharts
Flowcharts are an essential planning tool in the conceptual design phase. A flowchart visualizes pages and the navigational flow between them. Flowcharts are indispensable for organizing complex information and user interaction. They help identify bottlenecks, inconsistencies, or convoluted navigation paths and provide valuable insights for creating a user-friendly website structure.
Technically, a flowchart is a diagram that contains states and action steps. States typically represent static items like a web page or a particular form in a form flow. Action steps show the transition from one page or form to another. They can include decisions, for example, “Does the user want to register a new account for checkout?”
Often, a flowchart visualizes pages in wireframe format. This kind of flowchart is sometimes known as “wireflow”.
The Role of Flowcharts in Enhancing User Experience
The activities of a great artist look almost effortless: a professional juggler who keeps chainsaws flying through the air, a concert pianist whose fingers fly across the keyboard. Yet, we don’t see the large amounts of time and energy the artist invested beforehand to achieve a smooth flow.
When navigating through a large website feels effortless, it is often the result of intense work while building the site. A seamless user experience does not grow “organically” from simply piecing a website’s pages together. User flows need to be carefully planned. Flowcharts are the UX designer’s tool of choice for this task.
A user flow describes how a user interacts with a site to achieve a specific goal. A user can achieve that goal through multiple pathways, each representing a sequence of navigation steps between pages. Pathways are crucial because they represent specific patterns of user interaction. Capturing these pathways as visual representations allows UX designers to gain a profound understanding of user behavior, identify mismatches between ideal pathways and the existing website structure, and apply targeted adjustments and improvements to the website.
This may sound quite abstract, so here is a quick walkthrough of mapping out user pathways using a flowchart.
1. Identify the key steps in the user pathway.
List the user’s main actions to complete the task or process you are diagramming. For complex processes, you may need to break down high-level steps into more detailed sub-steps.
2. Map out the sequential flow.
Turn each action step from the list into an interaction on a page of your site. Connect the steps in the order they need to be completed using arrows showing the flow direction.
3. Add decision points.
Sometimes, the user or the system can choose between multiple options, and the outcome will determine the subsequent steps. Add a decision box (typically diamond-shaped) to visualize decision points with branches flowing from each option.
For example, a user might want to navigate to a page that requires login. If the user is already logged in, the system can let the user continue the flow; otherwise, the system routes the user through the login process before continuing.
4. Add swimlanes if needed.
For flows involving multiple users or systems, use horizontal or vertical swimlanes to indicate different processes.
For example, the checkout process might run on a third-party e-commerce system. A separate swimlane creates a visual distinction between your website and the payment processor.
5. Include annotations.
Some parts of the flow may not be obvious from the flowchart alone. Use text boxes to explain or clarify any complex elements of the flowchart.
6. Refine and simplify.
In this step, the flowchart can play out its strengths. With the user flow displayed in front of you, it is time to critically review and refine it by removing unnecessary steps, combining steps, or rearranging elements for greater clarity. Now is an ideal time to involve all stakeholders to review and discuss the flow.
Following these steps allows you to create a flowchart that accurately maps out the user pathway in a clear, visual diagram format.
While flowcharts are instrumental in visualizing the path users take on a website, it’s crucial to understand the foundational elements they represent - user flows and task flows. These flows are key to crafting a user experience that feels intuitive and seamless. For a comprehensive breakdown of user flows and task flows, and how they play a distinct yet interconnected role in UX design, be sure to read our in-depth exploration in ‘User Flows and Task Flows: A Guide to UX Design Processes’. This article will provide you with a deeper understanding of these crucial components in UX design.
Collaborative Design and Flowcharts
Designing a website is a highly collaborative process. UX designers, developers, and clients need to work closely together to create a website that matches the shared vision. Modern flowchart apps enable close communication and tight feedback loops through features like multi-user editing, annotations, and feedback channels. By collaborating on flowcharts, all parties can achieve a common perspective on the ideal user experience early in the process and work on a design that best aligns with the needs and goals of all stakeholders.
At b13, close collaboration with clients is key to creating highly tailored flowcharts that closely match their vision. We extract and then prioritize the critical user path scenarios during an initial workshop. Our UX designers, developers, and client stakeholders then communicate through tight feedback loops to turn these scenarios into flowcharts reflecting specific requirements and goals. This is an essential step for developing a UX design that precisely addresses our clients‘ needs and expectations, leading to a product with high satisfaction and acceptance rates among users.
Step-by-Step Guide to Creating Effective Flowcharts
With a flowchart tool, time, and not much effort, it’s easy to create convoluted flowcharts. Crafting an effective flowchart that reflects your user flow takes more effort but doesn’t have to be rocket science if you follow these tried and tested steps. From a high-level viewpoint, the process consists of three main blocks: preparation, creation, and refinement.
Prepare: Choose The Right Tools And Templates
Choosing the right tooling is key for efficiently designing and collaborating on flowcharts.
Of course, you can use paper and pens, but specialized flowchart apps are the best option if you need a quick start. Predefined templates and tailored editing tools get you up and running in no time. Flowmapp is an example of such a specialized app. But if you are willing to spend a little time creating your own templates, general diagramming tools also do a decent job. Apps like Figma or Miro are general diagramming apps that allow creating reusable components to build up a library of flowchart symbols.
We discuss tooling for user flows in great detail here: Choosing a User Flow Tool: A Comprehensive Guide with b13.
Whatever tool you pick, ensure it provides collaboration features like multi-user editing or commenting and features indirectly supporting collaboration, like versioning or layering.
A good app should enable you to efficiently design and discuss even complex user flows.
Create: Map Out The Main Pages And Navigation Paths
The main part of the process consists of turning an existing or planned website into a set of user flows. Have your user stories and user journeys at hand when you start this step, as you will need both to define user flows and pathways.
Think about how your users may want to interact with your websites. Identify typical personas like the “search engine” type, the “I need clear menus” type, and so on. Each persona prefers a specific way of accessing and navigating your site. Make sure that your user stories and journeys cover these preferred behaviors.
Refine: Incorporate Feedback And Apply Iterative Changes
Although the Refine step is listed as a separate block, it can be (and often is) tightly intertwined with the Create step. In fact, getting feedback from stakeholders early and often is indispensable for quickly iterating towards an optimal design.
This is where the collaboration features come into play. A flowchart or diagram app that allows collaborative editing and commenting is your high-speed route to completing the design according to the client’s wishes. But even without built-in collaboration, you have options available, from video conferencing to exporting the flowcharts to an interchangeable format (even flat PDFs can do) to send to your clients and get them back with annotations.
If your flowchart app supports versioning, you can easily go back and forth between revisions to see the evolution of the flowchart over time and easily escape from dead ends to try another path.
A Visual Guide to Creating a Flowchart
With the three main blocks in mind, here is a working example of a visual walkthrough of creating a flowchart from the first sketches to the final version.
Let’s use the example of a website that sells all sorts of art supplies. The walkthrough starts with a user story and parts from a website (home page, blog page, product catalog, product page, checkout).
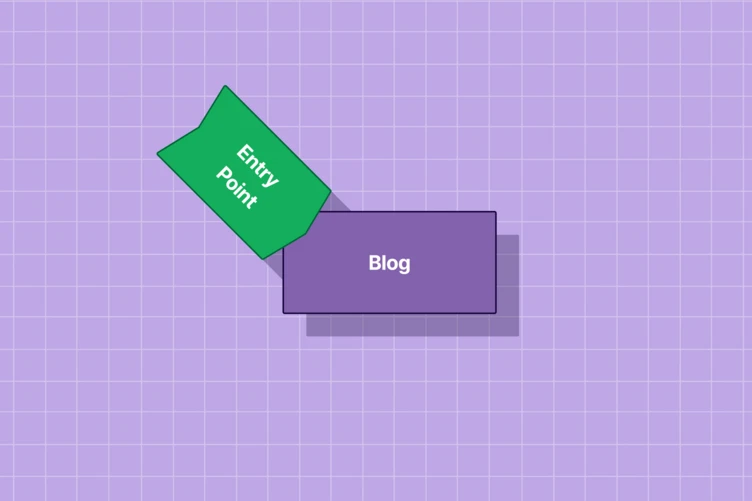
Your first step is to lay out the pages of your website. The user story, extremely simplified, could go like this:
As an architect, I need a set of reliable precision fineliner pens that can be filled with waterproof ink.
This user might land on the site at different locations:
- On the homepage
- On a blog article that discusses various fineliner pens
- On the fineliners category page of the product catalog
- On a product page of fineliners
The user then can move on in different ways:
- Through the navigation menu
- By using the site’s search engine
If the user intends to buy fineliners, they will proceed until they complete the checkout process.
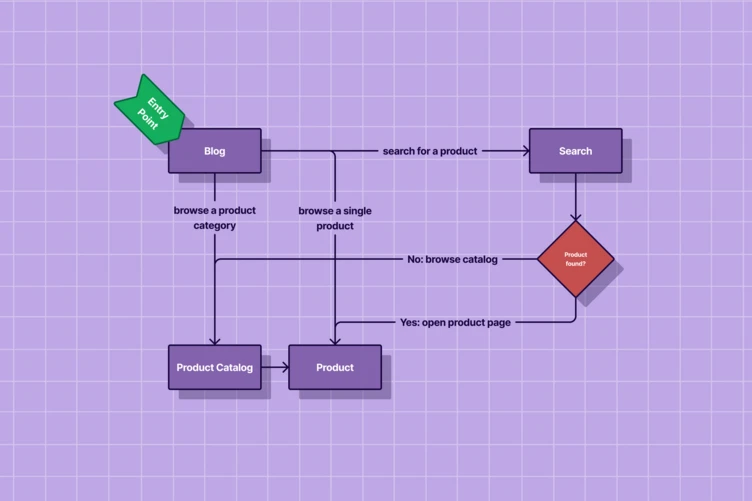
From these steps, you can construct several user pathways already. Let’s pick one possible flow from the options above to keep the example simple.
The user may start from a blog page found by searching the web for a particular brand of fineliners.
On the blog page, the user might follow the product page link, go to the product catalog to browse more fineliner pens or use the site search to find the exact pen.
Once the user finds the desired product and decides to buy it, the flow moves on through the pricing page, the purchase page, and the checkout flow (that the user might cancel at any time).
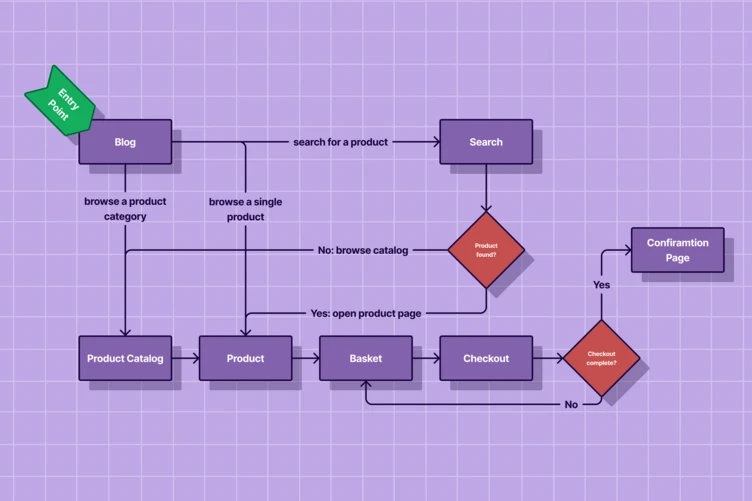
Looking closer, this flow can have more than one entry point. Users can enter a product page or the product catalog directly from a search engine, or they can start at the home page and use the menu to navigate to the blog or the search bar to find a particular product.
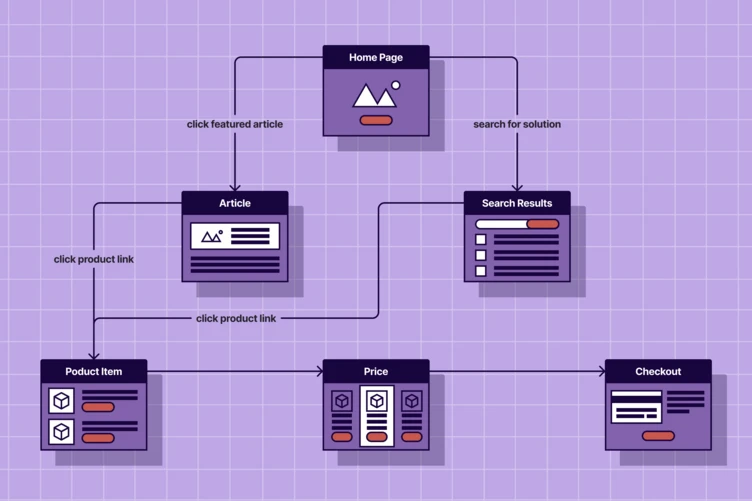
The complete flowchart now might look like this:
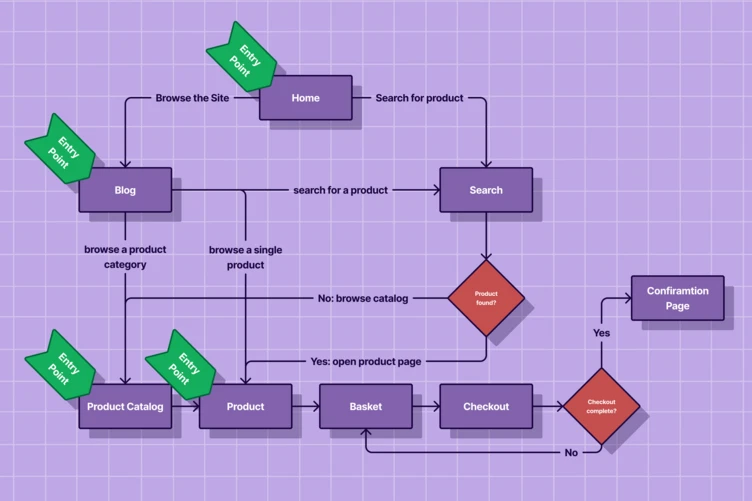
Although the user has several options for finding and purchasing the desired product, the flowchart maintains a clear view of all possible paths the user can take through the site.
Advanced Flowchart Techniques for Comprehensive Design
User flows can become fairly large and convoluted. To manage complexity, advanced flowchart tools provide additional functionality for structuring diagrams.
Conditional formatting
When working with large flowcharts, it’s a good idea to establish formatting rules to keep the flowchart clear and consistent. For example, use different base colors for page thumbnails to indicate their type: landing pages could be green, blog pages yellow, product pages blue, and so on.
To ensure these rules are applied consistently, some flowchart tools allow defining conditions that trigger automatic formatting. In the above example, a condition could specify that all pages with the “Landing Page” attribute turn green. Conditional formatting improves readability and makes creating and editing flowcharts faster and easier.
Data linking
Data linking allows you to take data from sources like spreadsheets or databases and dynamically include them in a diagram.
For example, the flowchart could include data from the website analytics database to incorporate user metrics such as the user traffic on each page, successful checkouts, or bounce rates.
Combined with conditional formatting, the flowchart could colorize pages by traffic, mark pages with high bounce rates, or highlight landing pages that lead to high checkout rates.
Layers
Occasionally, you might want to capture the same user flow at different detail levels. For example, you might want to:
- See a high-level view of the main navigation flow and a zoomed-in view of users interacting with content inside a page (such as expanding a summary/detail view).
- Work on variations of a user flow to identify the most effective ways of helping the user complete the journey.
- Separate user flows that include the site’s search engine from those that don’t.
These goals can be achieved using layers, similar to how graphics apps use layers to separate parts of an image. Layers can be shown or hidden, allowing to include multiple flows or multiple aspects of a flow in a single flowchart document.
Integrating Flowcharts into the Web Design Process at b13
In the conceptual stage of our web design process, our UX designers use flowcharts to plan the website’s basic structure and communicate this structure to our developers and clients. Visualizing pages, content, and interaction flows early on has two advantages: First, the whole team and all stakeholders get a clear understanding of the resulting user experience. Second, the flowcharts reveal opportunities for addressing challenges and optimizing the user experience. Designers, developers, and stakeholders can use the flowcharts for discussing and refining ideas and concepts. Ultimately, flowcharts help lay the foundation for successfully implementing all subsequent stages of the web design process.
Security, Compliance, and Flowcharts
Security and compliance are topics that probably are not on everyone’s radar when it comes to creating web flowcharts. But considering that flowcharts can be based on real customer data and thus reveal sensitive details about a company’s products, services, marketing strategies, target audiences, and more, security should not be an afterthought. Despite being “just some graphics,” flowcharts need to be treated like any other sensitive data.
At b13, we know about the extreme importance of data security, and we take appropriate security measures to protect projects from unauthorized access.
Flowcharts can, in turn, also help improve security. They can highlight the parts of a user flow that deal with untrusted input data or database interactions and help stakeholders see areas of potential vulnerability.
The Future of Flowcharts in Web Design
Flowcharts are an established technique, but this does not mean they cannot, and do not, evolve. Innovations from the outside can influence how we will do flowcharts in the future.
How artificial intelligence and virtual or augmented reality might influence flowchart design
Artificial intelligence (AI) made a giant step forward by introducing large language models (LLMs) like ChatGPT or text-to-image algorithms like Stable Diffusion for image generation. Prompted with a question or request, these models generate a response based on large quantities of training data. Software developers use such models to generate code based on specific requirements. Along the same lines, LLMs could also be used to turn textual descriptions of a user’s goal and a website structure into user flows and pathways. Or an LLM could analyze a given flowchart and suggest optimizations.
Virtual reality (VR) is a technology that uses specific hardware to let the user immerse themselves in a virtual world. Typical VR hardware consists of a headset with built-in stereographic screens and head- and eye-tracking sensors that allow the user to watch and interact with a three-dimensional scene without the borders a normal monitor would have.
Augmented reality (AR) is similar to VR but produces a blend of the virtual and the real world. The user can see the real environment with virtual objects placed in it.
Both VR and AR have the potential to make flowchart creation more direct and collaborative.
Web Flowcharts—Not To be Underestimated
Flowcharts might appear to be nothing more than an intermediate—and maybe even optional—phase between analysis and the website-building process. Yet, they play an important role in clarifying content structure, streamlining conversion funnels, optimizing search engine rankings, and giving website users a cohesive experience.
Your web design can benefit enormously from including flowcharts in the analysis and design phase. That’s why flowcharts are integral to the web design processes at b13.
We just explored the intricacies of web flowcharts and their vital role in creating intuitive and user-friendly website structures. To our readers we have to mention that it’s important to remember that this is just one aspect of a broader UX design strategy. For a holistic view of how these elements fit into the overall user experience design, including detailed insights into user flow design, we highly recommend visiting our comprehensive guide, ‘Excelling in User Flow Design: A Comprehensive Guide to Best Practices in UX‘. This pillar article offers an extensive look at the nuances of user flow design, providing a thorough understanding of how to create digital experiences that resonate with users.
Get in touch with us to learn more about our offerings around web design and flowchart needs.